A Value Map of the Banking System: Fundamental P/BV vs. Market P/BV
An empirical assessment of the relationship between equity market value and market return expectation over the banking system in Italy, the EU and the US.
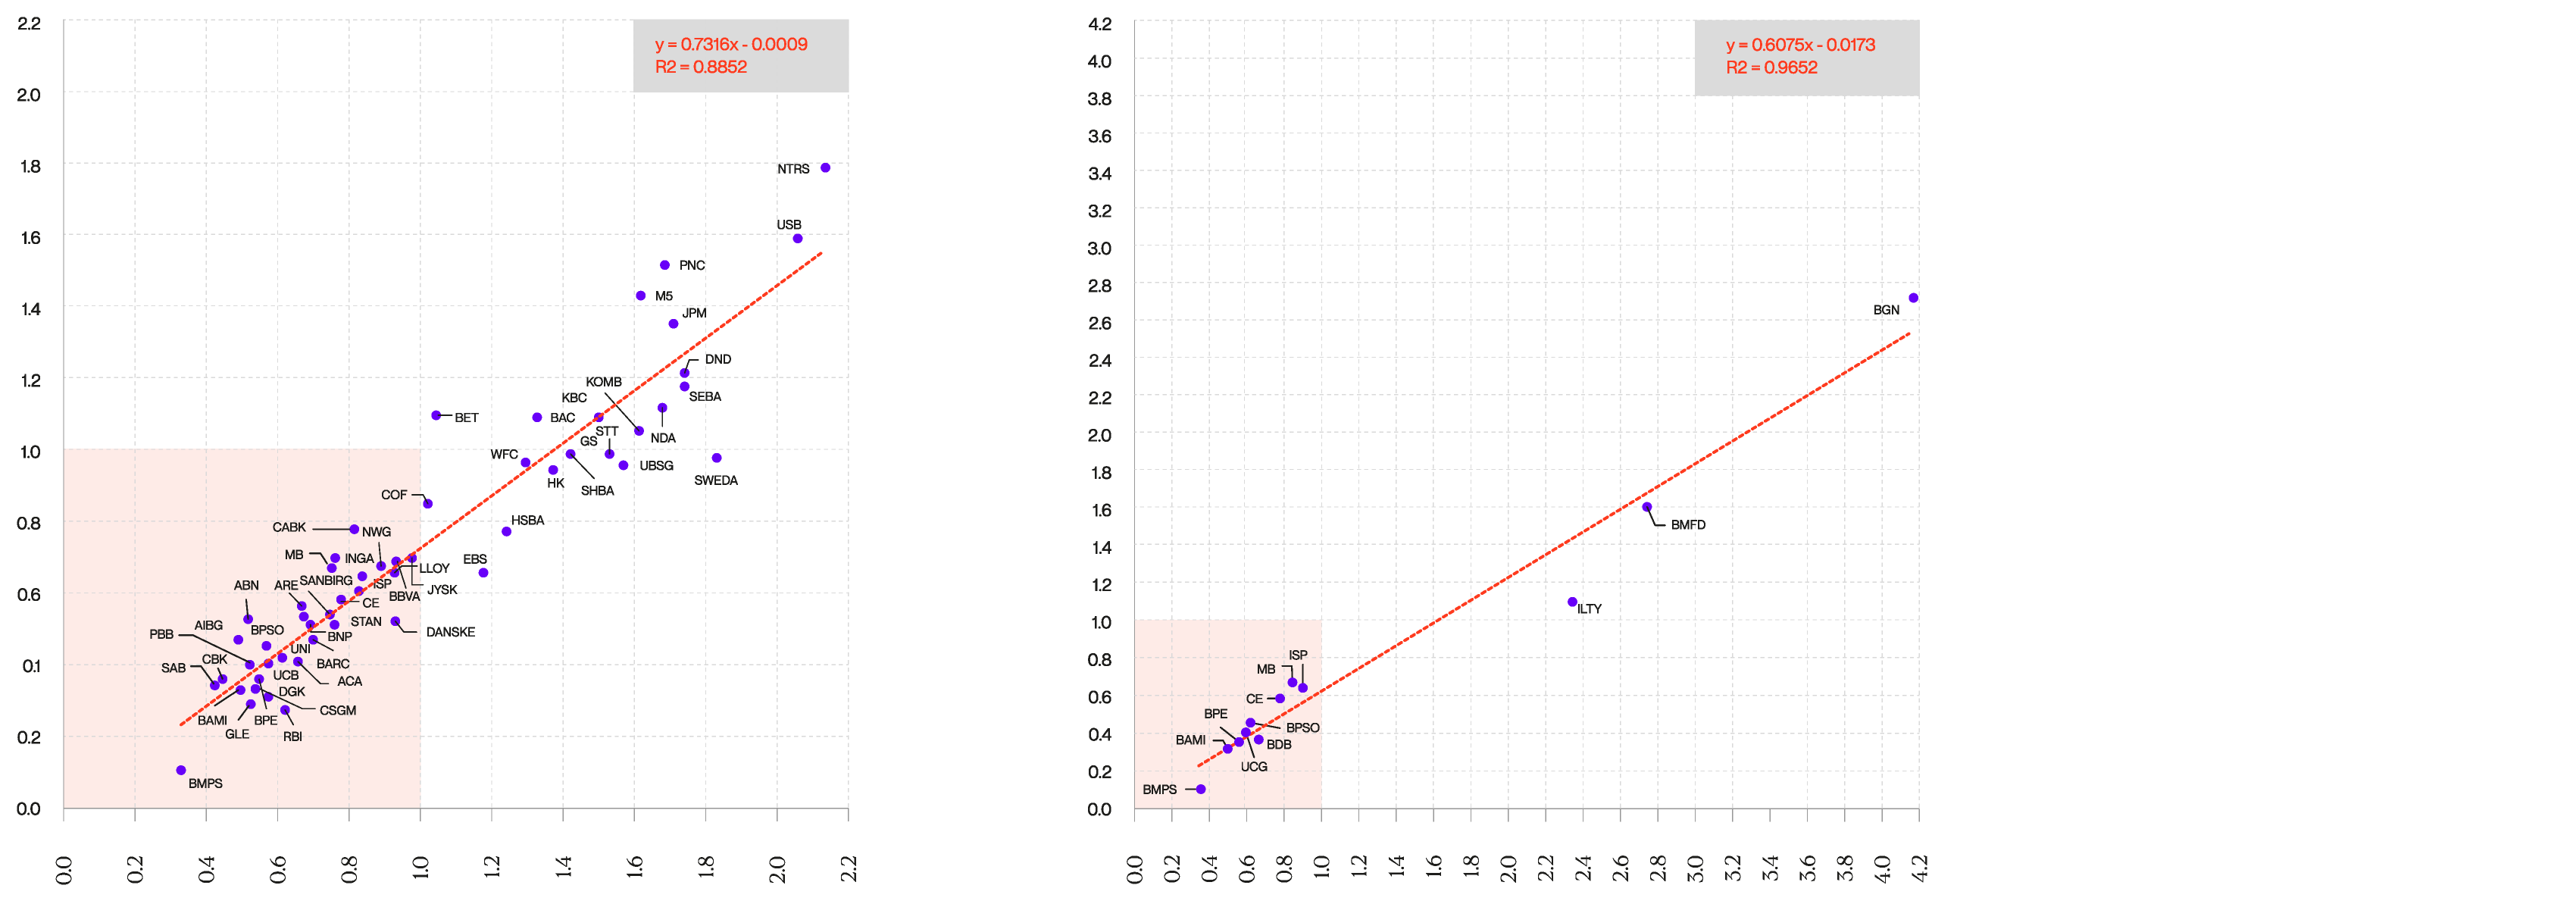
We developed a value map of the banking system (Italy, EU and USA) which reports the empirical relationship between market P/BV and implied P/BV, whereas the latter is given by the bank’s multiple fair value estimated through a simplified model which incorporates market expectations over the bank’s future profitability. In this way we investigate how much investors’ return expectations are reflected into banks’ market prices.
The implied P/BV has been estimated using the following formula: Implied BV= ROE -g / COE – g
where ROE is the bank’s expected return on equity, COE is its cost of equity and g is the perpetual rate of growth of its total assets.
The assumptions underlying this very simple are steady state condition and growth at a constant level g. The forecast assumptions adopted to apply the model are:
- ROE: 2-year consensus median (at each estimate date).
- COE: determined on the basis of CAPM; considering the risk-free rates and market risk premiums provided for each country by Fernandez et al. (2022) and Betas estimated using the last-5-years weekly data (for both the bank price shares and the corresponding stock market country index).
- g: is set at 3% as a proxy of long-term growth of the economy.
It is worth noting that the implied P/EBV multiple estimated on the basis of the expected ROE fits almost perfectly the actual market multiple; it is rare to find such strong empirical relationships in the financial market. It looks like that investors make decisions on the basis of a few variables, well summarized by the formula above, and that therefore the banking business can be satisfactory evaluated by using a very simple model, easy to apply, respect to other more complex valuation modeling.
Thus empirical evidence shows that banks’ market prices strictly incorporate ROE expectations and that banks with higher/lower expected ROE quote with higher/lower market multiples according to a linear relationship.